
Tactical Financial Engineering
Temporal Portfolio Theory and True Sector Rotation.Merlyn.AI harnesses momentum investing strategies that requires time-based market data. This is the key difference that transforms our methodology past MPT into Temporal Portfolio Theory (TPT)
Merlyn.AI utilizes the same engineering science that has enabled WiFi, USB, iPhones, Digital TV, even the Mars Rover. Our technology, culture and vernacular have all considerably evolved since 1952. Likewise, portfolio theory has evolved from MPT’s simplistic ‘diversified buy-and-hold’ methodology to TPT’s advanced “adaptive momentum” methodology.
We utilize AlphaDroid Algorithms for True Sector Rotation. Unlike other investment theories, AlphaDroid’s algorithms make decisions based on market realities. This specifically avoids basing decisions on cycles, patterns, correlations, or what the talking heads believe the market should be doing.
AlphaDroid is designed to break through efficient frontiers, which is why it fits into our philosophy.
Know when the market is safe or unsafe with Stormguard Armor

StormGuard-Armor
StormGuard-Armor is the canary we bring into the coalmine to help avoid – and even profit in – the worst market conditions with the right preparation.
StormGuard closely monitors the 3 biggest indicators of a bear market: Price trend - Momentum – Sentiment
When a storm is brewing, this built-in circuit breaker will shift into bear market strategies with momentum for continued earning.
SwanGaurd
This part of the StormGuard Armor. It is designed to address rare, fast, and harsh “Black Swan Events” and will exit the market quickly without waiting for month-end

Forward Walk Progressive Tuning
Too often, backtesting will mask potential issues with a strategy ’ s performance. We, however, use the gold standard of backtesting. Forward-Walk Progressive Tuning is the next evolution because it removes hindsight bias.
Our backtesting is completely transparent in that it shows you exactly what actually occurred at any given time throughout the lifetime of the strategy. Its history is not adjusted or edited in order to paint a better picture-
quite the opposite. Its history is the thing that actually creates a better picture moving forward, because it is constantly learning new information, re-tuning, and then applying it.
After defining a ‘Born On Date, ’ the algorithm refreshes and incorporates the latest data every 125 days. This re-tuned algorithm then makes decisions during the next subsequent 125-day period. This means we can better determine
the efficacy of any given strategy you might be considering. Think of forward-walk progressive tuning like the GPS-directional mobile app Waze. The algorithm, like Waze, is constantly taking in new information to give you a smoother
ride.

Tactical Financial Engineering
Differential Signal Processing or differential signaling is a method of transferring information using two complementary signals. Differential signaling is often used in computers to reduce electromagnetic
interference. Every time you get a text or a phone call on your cell, you’ve just benefitted from differential signaling.
Signal-to-noise Ratio this is a measure used in science and engineering that compares the level of a desired signal to the level of background noise. Think noise-cancelling headphones. We
aim to find the signal through the noise

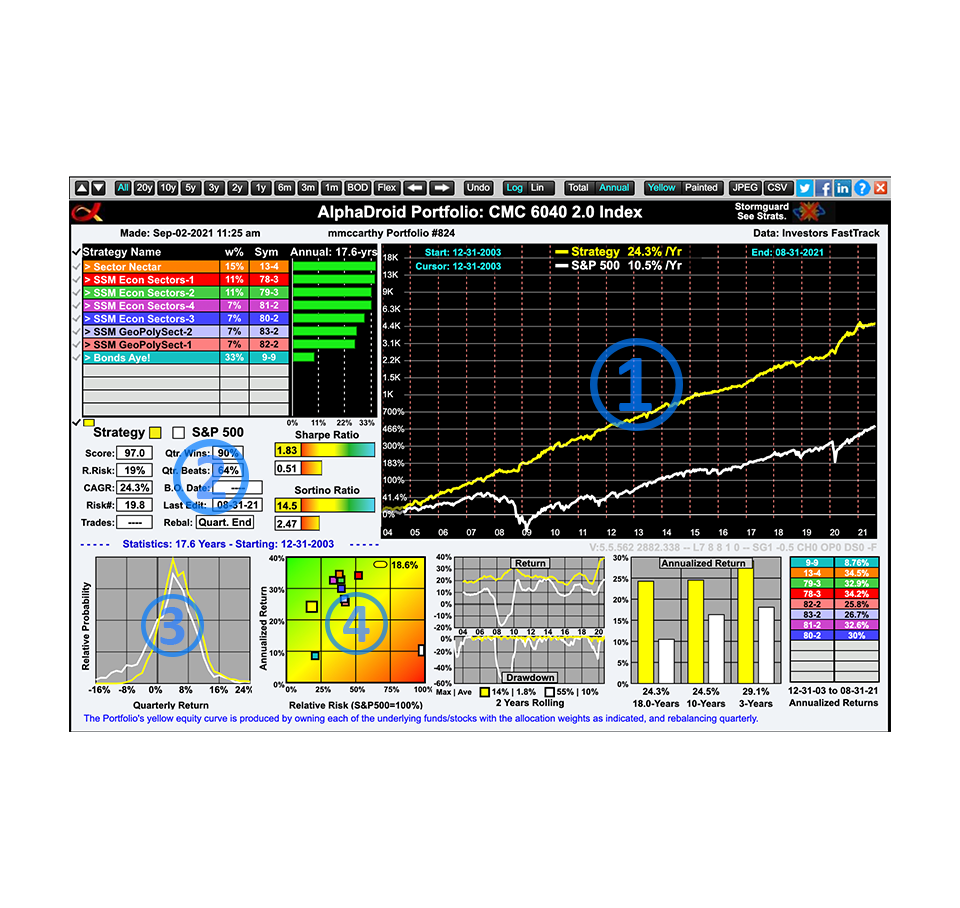
Hover Over a Number
1) The yellow line represents a CMC portfolio and the white line represents the S&P 500. Notice anything? That’s right - the CMC 6040 has outperformed the S&P 500 handily. On average, the return to the S&P 500 was 10.2% per year whereas our design returned 24.5%
2) The CMC 6040 was profitable in 90% of the quarters and it outperformed the S&P 500 65% of the time. Odds that help us tilt the field in your favor.
3) This chart describes the ‘tail risk’ pundits like to talk about. It’s the probability of a rare event with huge losses. Look to the left of 0 on this chart – you’ll see the S&P 500 has a higher risk of -8% to -16% losses, whereas the CMC 6040 significantly reduces the risk of these huge-loss events.
4) Notice first where the white dot representing the S&P 500 is. The S&P 500 was only able to capture 10.2% of return while being 100% exposed to the risk. Not ideal! Whereas the CMC 6040 captured a robust 24.5% return while only being exposed to 18.4% of the risk.
Tactical Financial Engineering
Machine learning has evolved to actively utilize the momentum in market data.
Learn more about the engineering principles that we trust to help us manage portfolios. Some of this engineering
is more familiar than you may think. You may be surprised that some of these principles are already integrated into your daily life.
- Temporal Portfolio Theory & True Sector Rotation
- Storgaurd Armor and Swanguard
- Forward Walk Progressive Tuning
- Differential Signal Processing & Signal-to-Noise Ratio
- Interactive Strategy Map


Connect With Us Today!
We use Merlyn.AI & AlphaDroid to tacitly Long story short, CMC can utilize these tools to cut your risk while increasing your return.
But don’t take our word for it. Click the button below to enter your information and access our ‘Income Stability Calculator.’